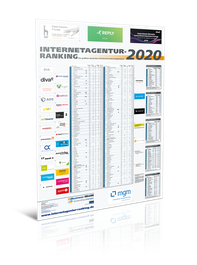
Das Internetagentur-Ranking 2018
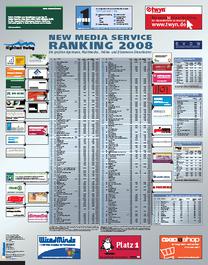
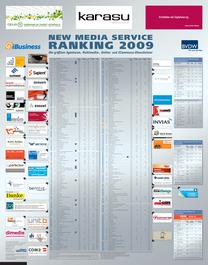
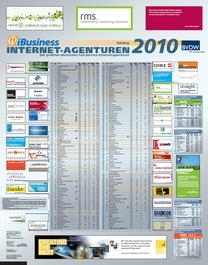
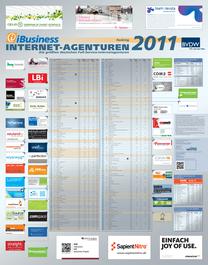
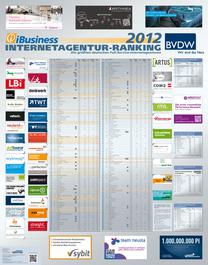
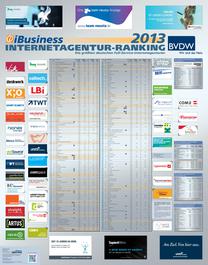
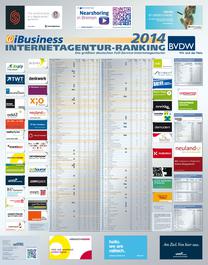
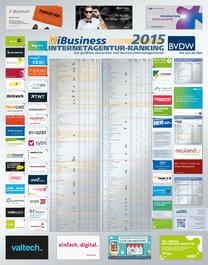
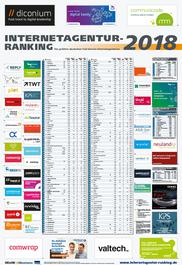
Das Internetagentur-Ranking 2018 listet die umsatzgrößten Full-Service-Internetagenturen. Das Ranking ist eine Initiative des Bundesverband Digitale Wirtschaft (BVDW) in Koproduktion mit iBusiness und den Marketing-Fachmagazinen Horizont und W&V.
Die Subrankings
Die Subrankings listen Agenturen, die mehr als 30% ihrer Umsätze im jeweiligen Spezialgebiet erzielen.
- Marketing/Branding
- E-Commerce
- Business Transformation
- Services / Information / Plattforms
- Online-Plattformen
- Intranet
- Mobile
Anwendungsbereich
Plattform
Die Top-10 des Internetagentur-Ranking 2018
| Rang 2018 (Vorj.) | Firma | Umsatz (Mio. Euro) |
Wachstum | ||
|---|---|---|---|---|---|
|
1
(3) 

|

|
team neusta | 104,000 | 23.8 % | |
|
|||||
|
2
(2) 
|

|
Plan.Net Gruppe | 96,463 | 7.0 % | |
|
Diese Agentur stellt ein: Stellenmarkt
|
|||||
|
3
(4) 
|
|
Reply - Digital Experience | 86,013 | 23.7 % | |
|
|||||
|
4
(10) 

|
|
diva-e Digital Value Excellence | 66,846 | 28.5 % | |
|
|||||
|
5
(6) |

|
PIA Performance Interactive Alliance | 66,075 | 3.5 % | |
|
|||||
|
6
(9) |
SinnerSchrader AG | 57,830 | 10.9 % | ||
|
|||||
|
7
(7) |

|
diconium GmbH | 57,759 | 4.4 % | |
|
|||||
|
8
(13) |

|
Valtech GmbH | 57,588 | 39.5 % | |
|
|||||
|
9
(11) 
|
mgm technology partners | 49,914 | 5.5 % | ||
|
|||||
|
10
(12) 
|
C3 Creative Code and Content GmbH | 47,520 | 6.9 % | ||
|
|||||

